 EN
EN JP
JP KR
KR
Power BI vs Tableau: Which Is Better?
In today's digital era, data analysis is not just a support tool but a key to gaining a competitive advantage. Among the leading data analysis tools in the market are Power BI by Microsoft and Tableau. This article provides an in-depth comparison of these two tools, helping you understand their strengths and weaknesses to make the best choice for your business.
1. Overview of Power BI and Tableau
Power BI and Tableau are powerful data analysis tools that cater to different business needs and objectives.
Power BI
Power BI is part of the Microsoft ecosystem, designed to help users easily connect, analyze, and visualize data. With a user-friendly interface and deep integration with other Microsoft applications like Excel, Azure, and SharePoint, Power BI is preferred for businesses already utilizing Microsoft products. It offers features such as interactive reports, customizable dashboards, and seamless report sharing through Microsoft's cloud services.
Another strength of Power BI is its robust integration with other cloud services like Google Analytics, Salesforce, and various other data sources. This allows businesses to effortlessly connect and analyze data from multiple sources without complex processes.
Tableau
Developed by Tableau Software and now owned by Salesforce, Tableau stands out for its powerful and flexible data visualization capabilities. It enables users to create dynamic and visually appealing dashboards, making data easier to understand and interpret. Tableau supports a wide range of data sources, from traditional databases like SQL Server and Oracle to cloud services like Google BigQuery and Amazon Redshift.
Tableau is highly regarded by its user community for its flexibility and ability to handle large datasets while maintaining high performance. This makes Tableau the top choice for organizations that require complex and detailed data analysis.
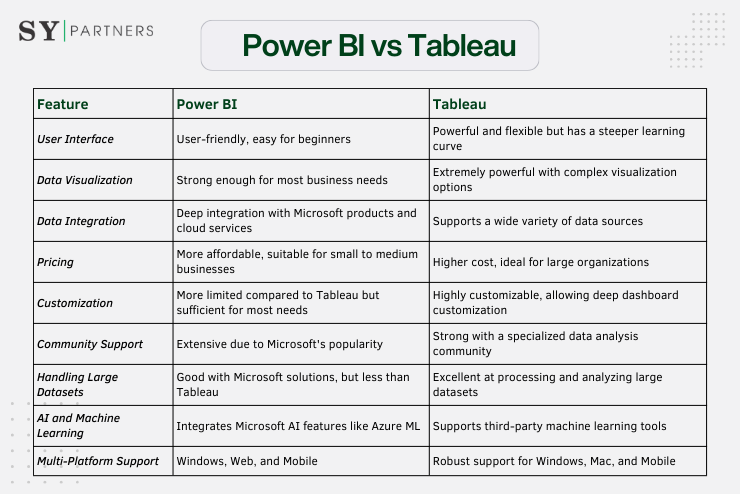
2. Power BI vs Tableau: A Comprehensive Comparison
To better understand the differences between Power BI and Tableau, let's examine some key features of each tool through the comparison table below:
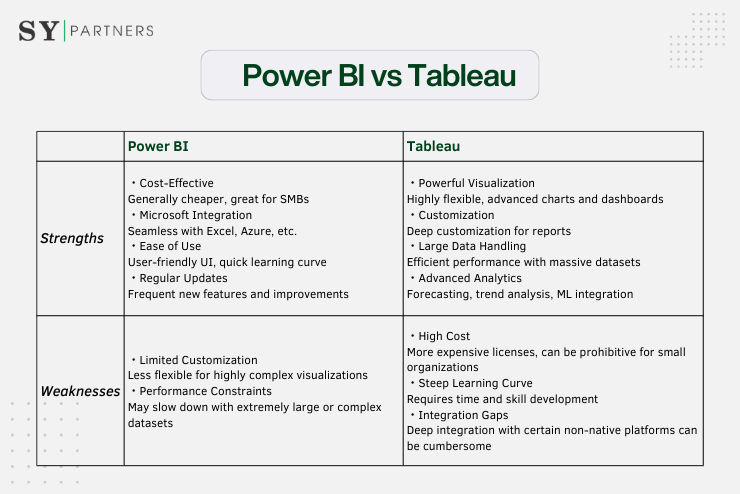
3. Strengths & Weaknesses: Power BI vs Tableau
Below is a concise side-by-side table summarizing the key strengths and weaknesses of both tools:
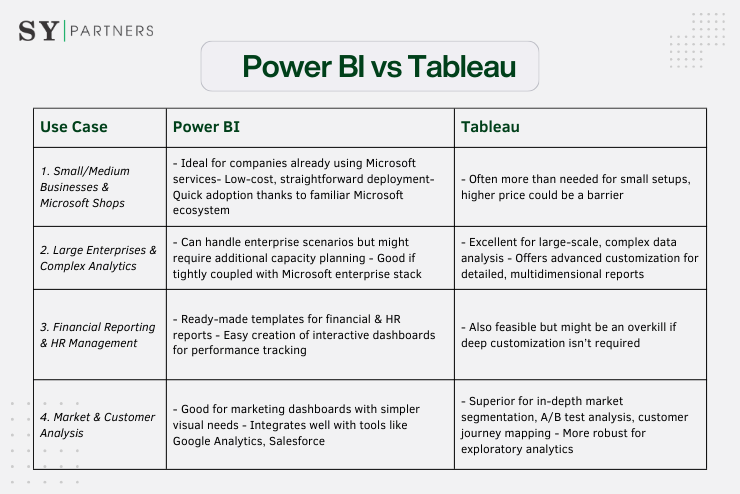
4. Common Use Cases: Power BI vs Tableau
Here is a direct comparison of typical scenarios in which each tool excels:
5. Choosing the Right Tool
When selecting between Power BI and Tableau, businesses should consider factors such as scale, budget, data analysis requirements, and the level of integration with existing systems.
If you're looking for a cost-effective, easy-to-use solution with strong integration with Microsoft products, Power BI is the right choice.
Conversely, if you need a powerful, flexible data analysis tool and are willing to invest in a premium solution, Tableau is the better option.
6. Next Steps
Both Power BI and Tableau are powerful tools that help businesses maximize the value of their data. However, the choice between them depends on the specific needs and long-term strategies of each organization. In our upcoming articles, we will explore how to optimize the use of these tools in a business environment, as well as new trends in data analysis that you shouldn't miss.